
A Gantt chart is a timeline-based visual representation of a project, showing the tasks needed to complete the project and the duration of each task.
It’s a simple but powerful tool that can help you get an overview of your project while providing useful detail to team members who will be working on various parts of the project.
What Is a gantt chart
What Is a gantt chart for projects?
Gantt charts are a type of bar chart that show project tasks and their progress over time. The gantt chart is one of the most important tools in project management. Gantt charts highlight:
Project start and end dates — the first thing a gantt chart does is establish the start and end dates for your project, which can help you identify any potential conflicts or problems with your timeline
– Task durations.
– Resources.
– Task dependencies.
– Reporting.
Ever wondered how project managers keep everything on track?
Enter the Gantt chart, a powerful tool that’s become synonymous with project planning and management.
It’s a visual representation that lays out all the tasks involved in a project against a timeline, giving teams an at-a-glance understanding of what needs to be done and when.
We’ll jump into the nuts and bolts of Gantt charts, showing you how they can transform complex projects into manageable tasks.

Whether you’re a seasoned pro or new to project management, mastering the Gantt chart could be the game-changer you’ve been looking for.
Stick with us as we unpack the secrets to successful project visualization and execution.
What Is A Gantt Chart
A Gantt chart is a project management tool that’s indispensable in our filmmaking process.
It serves as a visual roadmap, displaying all the scheduled tasks across a project’s timeline.
This not only helps in organizing shoots but also in post-production phases where multiple tasks need to be coordinated simultaneously.
When managing a film project, we find that a Gantt chart is key to communicating the timeline and the sequence of events to all team members.
It provides an at-a-glance overview of the following elements:
- Start and end dates for each task,
- The order of operations required,
- Task dependencies – which activities need to be completed before others can start,
- Overlaps and gaps between tasks, demonstrating resource allocation.
These charts are particularly useful when we have complex scenes or sequences that depend on a variety of factors like actor availability, location permitting, and special effects coordination.
With the use of a Gantt chart, we can easily adjust schedules on the fly without losing sight of the larger picture.
While traditional pen and paper charts have been used historically, we now leverage digital tools that offer more dynamic and collaborative Gantt chart experiences.
These digital platforms Help real-time updates and allow for easier adjustments, ensuring everyone stays informed of any schedule changes.
No matter the size of the film project, a well-structured Gantt chart is a powerful tool that enhances our productivity and helps us meet our project milestones.
Whether we’re coordinating a small indie film or a large-scale commercial production, Gantt charts anchor our project planning with clarity and precision.
Incorporating a Gantt chart into the workflow allows us to effectively manage time, resources, and personnel.
It’s a strategic approach that ensures we can deliver our creative vision on time and on budget, while maintaining the flexibility needed in the often unpredictable world of film production.
Importance Of Gantt Charts In Project Management
Gantt charts have become essential tools in project management, particularly within the realm of filmmaking.
Their visual layout provides us with clear timelines and task organization, two critical components when managing complex projects.
A well-constructed Gantt chart offers a detailed view of all ongoing processes, enabling us to monitor progress and pinpoint potential delays early.
It’s not just about tracking; it’s about preemptive problem-solving and maintaining workflow fluidity.
For larger productions like The Lord of the Rings trilogy, Gantt charts are indispensable.
They synchronize the efforts of different departments, ensuring that everyone is aligned with the project’s overarching goals and timelines.
With the following advantages, it becomes clear why they’re a staple in our project management toolkit:
- Timeline Visualization – Seeing the entire scope of the project at a glance,
- Resource Allocation – Understanding who is doing what, and when,
- Dependency Tracking – Identifying how tasks relate and impact each other.
These charts also aid in communication across all levels of production.

They serve as a single source of truth that every team member can refer to, eliminating ambiguity and setting clear expectations.
The advent of digital Gantt chart tools has revolutionized their functionality.
We can now collaborate in real-time, making it easier to adopt an agile approach to filmmaking.
Edits and updates to the schedule reflect immediately, and everyone has access to the most current version of the plan.
eventually, Gantt charts foster a structured yet flexible environment for us to thrive in.
They empower us to handle multifaceted tasks while keeping a keen eye on our final goal – delivering a cinematic masterpiece.
How To Create A Gantt Chart
Creating a Gantt chart is straightforward when you follow a step-by-step approach.
First, list out all the tasks associated with your film project.
Determine the sequence of these tasks and their dependencies.
Identify which tasks must be completed before others can begin.
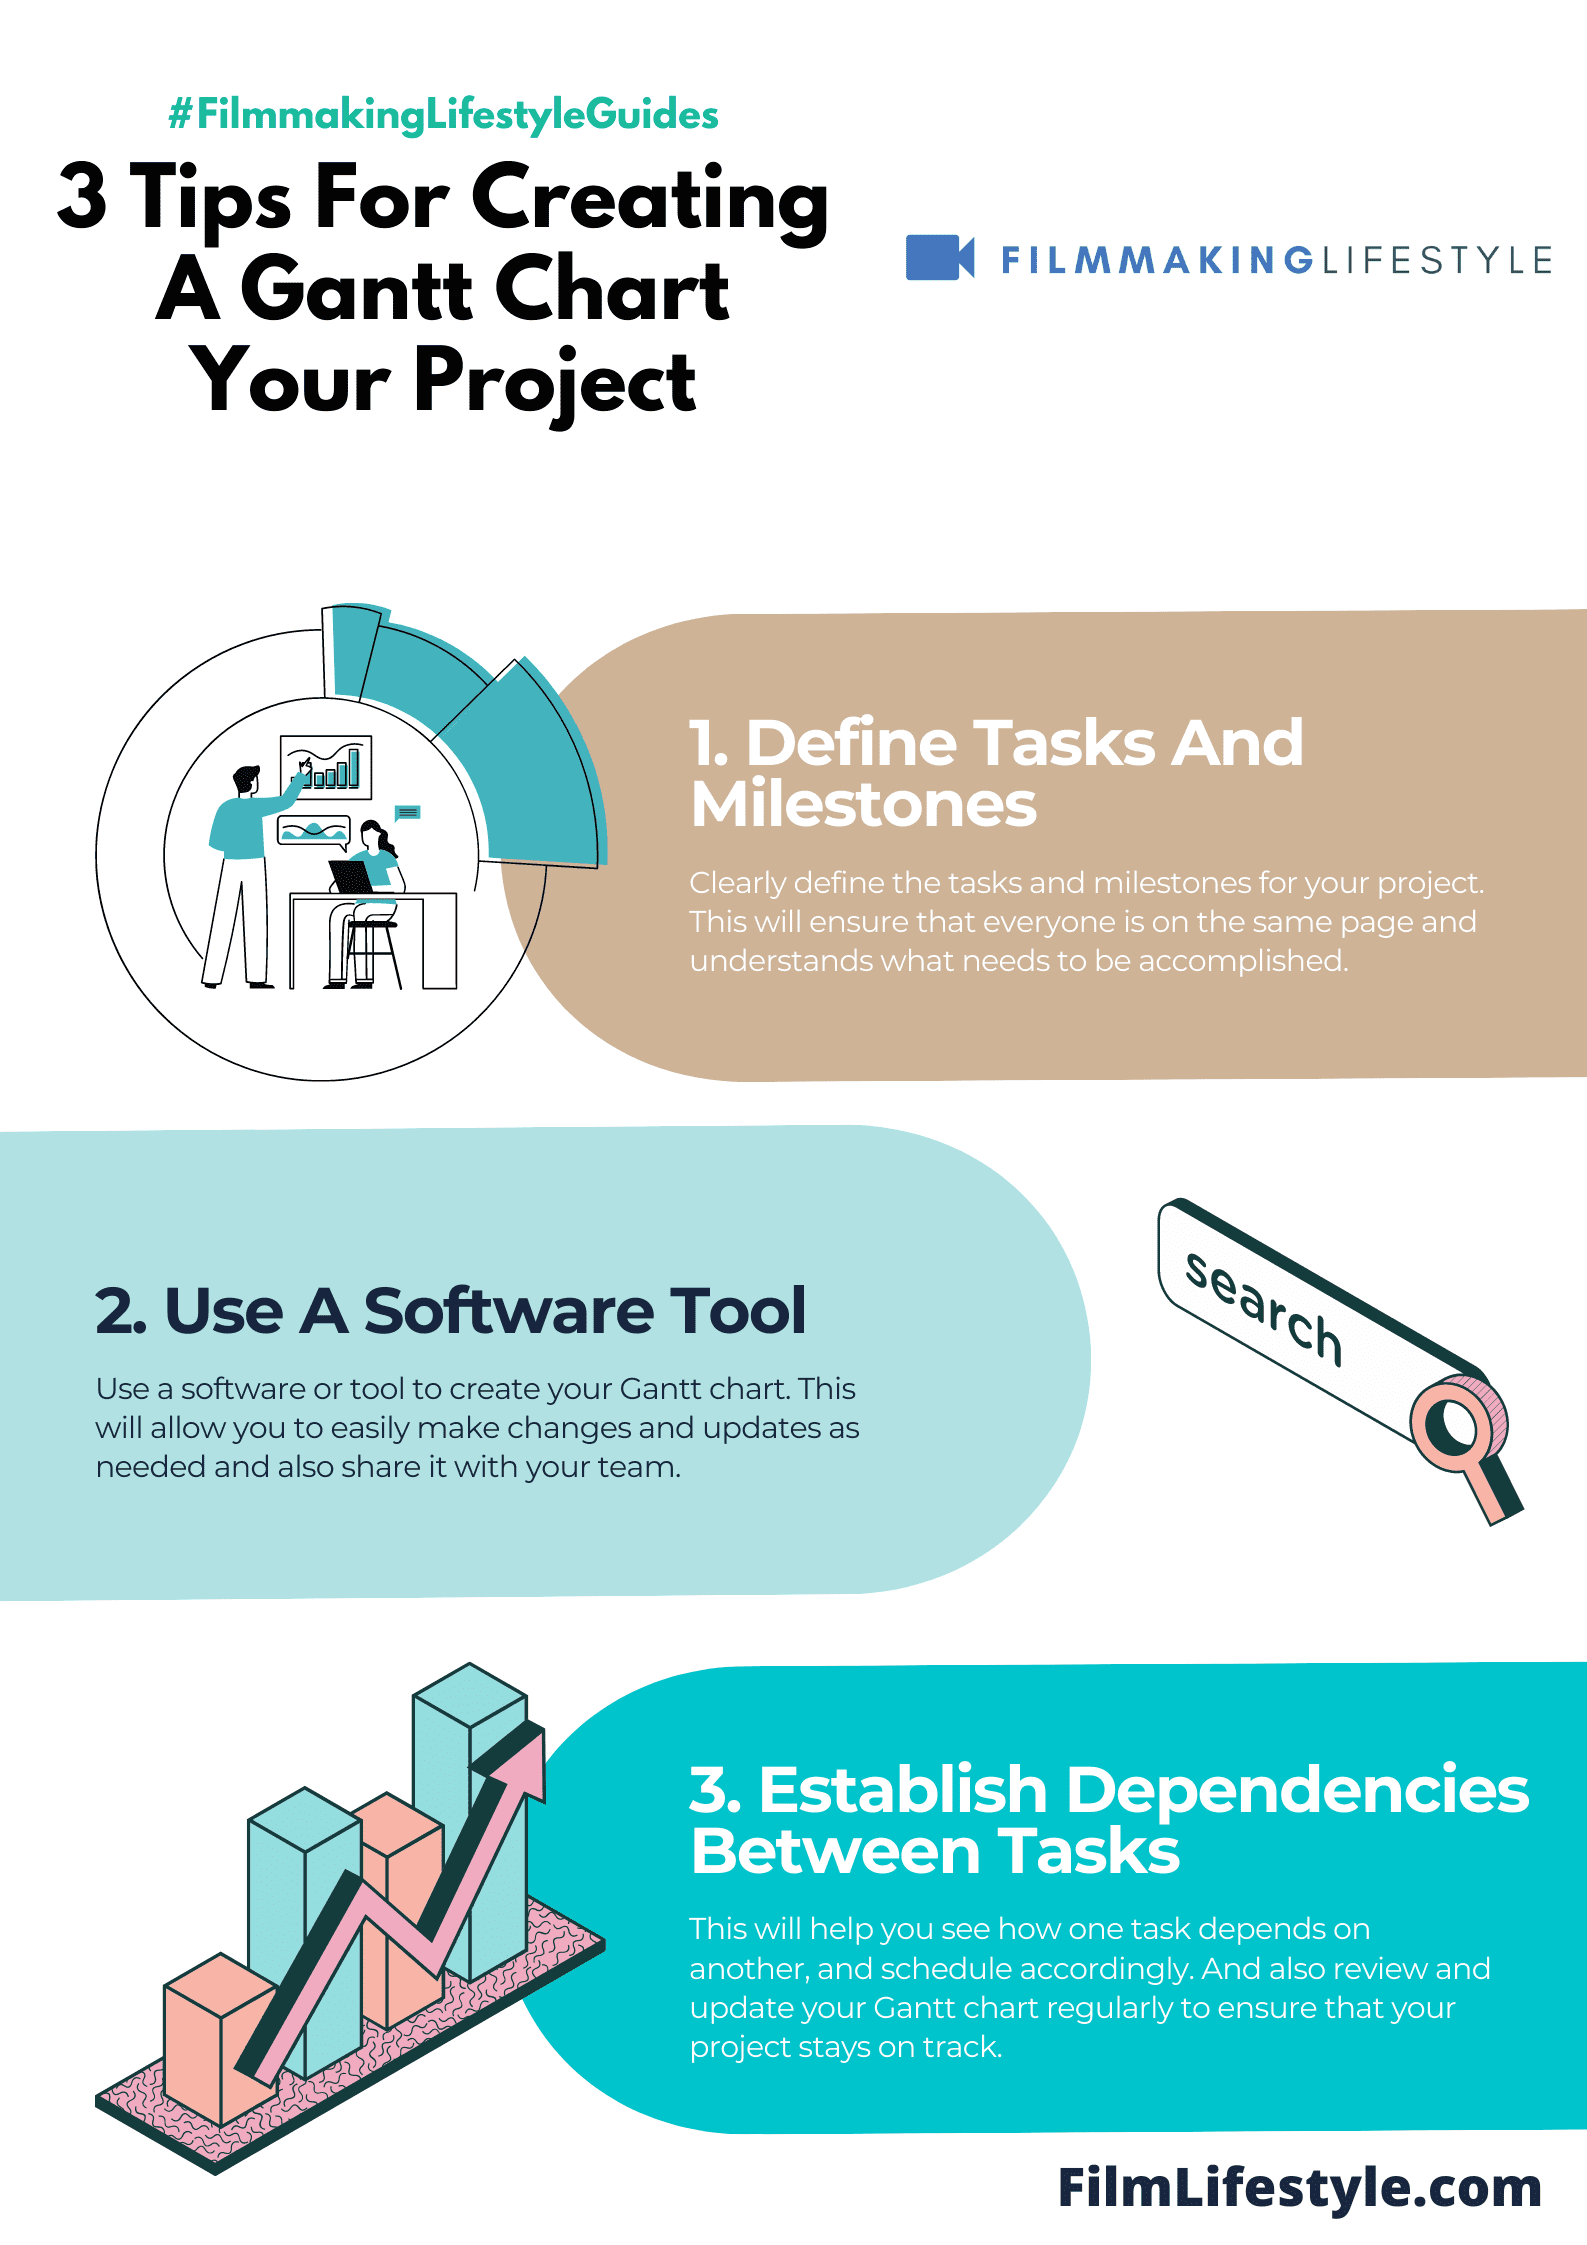
Assign start and end dates for each task.
This step forms the backbone of your Gantt chart and is crucial for accurate timeline visualization.
Allocate resources to each task.
Resources include personnel, equipment, and location, among others.
Here’s a snapshot of the essentials:
- Define project scope and individual tasks,
- Establish task sequences and dependencies,
- Set task durations and key milestones,
- Allocate resources and assign responsibilities.
Use a Gantt chart software to input this data.
Digital tools often have templates that make this process more efficient.
Regularly update your Gantt chart to reflect the current status of the project.
This is especially important as filming schedules can change frequently.
Remember, a well-constructed Gantt chart is not set in stone.
It’s a dynamic document that will evolve with your project’s needs.
Monitoring progress is imperative.
Regular updates ensure the chart remains a reliable tool for managing the filmmaking process.
Our Gantt charts are essential for maintaining an overview of The Lighthouse or any film project at hand.
They keep our team aligned and focused on the end goal.
In the end, it’s the flexibility and clarity of a Gantt chart that supports our teams through the complexities of filmmaking.
With the right tools and commitment to updating the chart, we can navigate the production timeline effectively.
Key Features And Components Of A Gantt Chart
Gantt charts are multifaceted tools that enable us to visualize a project’s timeline and progress with ease.
They consist of various features and components crucial for detailed project management in the realm of filmmaking.
At their core, these charts present the Start and End Dates for each task involved in a film project.
This allows us to establish a clear schedule and ensure that each phase of production adheres to the allocated timeframe.
By plotting these dates against a timescale, we obtain a comprehensive overview of the entire project duration.
Another key component is the Task List which outlines all activities that need to be completed.
Whether it’s location scouting or editing, every task is itemized to offer clarity on what needs to be done.
This list usually runs vertically down the left side of the chart and serves as a reference point for all team members.
Dependencies and Sequencing are also displayed on Gantt charts, illustrating how tasks are interconnected.
For example, in film production:
- Principal photography cannot Begin before casting is complete,
- Editing generally follows the wrap of shooting.
These relationships are represented through lines or arrows, enabling us to understand the sequence of actions and manage the workflow more effectively.
Resource Allocation is particularly beneficial as it maps out which team members or equipment are assigned to specific tasks.
This ensures that our resources are utilized efficiently and helps in avoiding any over allocation or scheduling conflicts that can disrupt the flow of production.
We also rely on the Progress Tracking feature, which visually indicates how much of the task has been completed at any given point.
As we regularly update the Gantt chart with the current status, it becomes a dynamic tool that guides our project to successful completion.
The final touch in a Gantt chart is often the Milestone marking, signifying key events or turning points.
Film premieres like the release of Inception or the launch of a new series are milestones that illustrate significant achievements within the project timeline.
These markers help maintain momentum and provide a psychological boost to the team as we hit each target.
By incorporating these components into our Gantt chart, we establish a solid foundation for managing complex film projects, ensuring every detail is accounted for and every deadline is met.
The effectiveness of a Gantt chart lies in its ability to translate the multifaceted nature of production into a clear, visual plan that can be easily understood and followed by the entire team.
Tips For Using Gantt Charts Effectively
In managing film projects, we know how essential it is to leverage tools like Gantt charts to their full potential.
Here are some tips for getting the most out of this indispensable planning resource.
Regular updates are crucial to maintain the chart’s relevance.
We should never let our Gantt chart become an outdated artifact; it needs to reflect reality to be a useful guide.
We must be realistic with the timeframes we assign to tasks.
Optimism can lead to tight schedules that don’t account for the usual delays and setbacks common in filmmaking.
Paring down tasks to the essentials helps in maintaining a clear focus.
We avoid cluttering the chart with every small task and instead feature elements that have a significant impact on the timeline.
We ensure effective communication by sharing the Gantt chart with all team members.
This promotes transparency and allows everyone to stay informed about the project’s progress.
Prioritization of tasks is a key element in successful project management.
We identify which tasks are critical to the project’s success and allocate resources accordingly.
The practice of assigning buffer times for contingencies keeps us ahead of the game.
Unexpected issues are a given in film production; buffer times help us navigate these without derailing the entire project schedule.
- Review and update regularly,
- Set realistic timeframes,
- Focus on key tasks,
- Share with the entire team,
- Prioritize critical tasks,
- Include buffer times.
Our strategic approach to Gantt chart management is a cornerstone of successful project execution.
As we build ours for The Great Escape or any other film project, these tips serve as our roadmap to a smooth production process.
What Is A Gantt Chart – Wrap Up
We’ve walked through the ins and outs of Gantt charts and their pivotal role in the world of filmmaking.
Armed with this knowledge we can tackle complex film projects with ease ensuring every aspect is meticulously planned and tracked.
By incorporating the tips we’ve shared Gantt charts become powerful tools that bring clarity and direction to our production schedules.
Let’s embrace this visual planning method to keep our projects on track and our teams in sync.
With Gantt charts in our arsenal we’re set to turn creative visions into cinematic realities.
Frequently Asked Questions
What Is A Gantt Chart And Why Is It Important In Filmmaking?
A Gantt chart is a visual project management tool that provides a timeline view of a project, displaying tasks, their duration, and dependencies.
In filmmaking, it’s essential for organizing the complex and multilayered aspects of production, ensuring clarity and timely completion of each component.
How Do You Create A Gantt Chart For A Film Project?
To create a Gantt chart for a film project, you list all tasks, determine the sequence and dependencies, assign start and end dates, allocate resources, and set milestones.
Then, you track progress against the timeline you’ve established.
What Are The Key Features Of A Gantt Chart In Project Management?
Key features of a Gantt chart include task lists, start and end dates, sequencing and task dependencies, resource allocation, progress tracking, and major milestones.
These elements are crucial for managing and visualizing the progress of complex projects.
Why Are Milestones Significant In A Gantt Chart?
Milestones are significant in a Gantt chart because they mark critical points along the project timeline, helping teams to prioritize efforts, track important deliverables, and stay aligned with the project’s overall schedule.
How Can Gantt Charts Be Used Effectively In Film Projects?
To use Gantt charts effectively in film projects, consistently review and update the chart, set realistic timelines, prioritize key tasks, share the plan with all team members, identify critical path tasks, and include buffer times for unexpected delays.